 This report was created by IPSR Academix Data Analytics Team.
Knowledge Hub
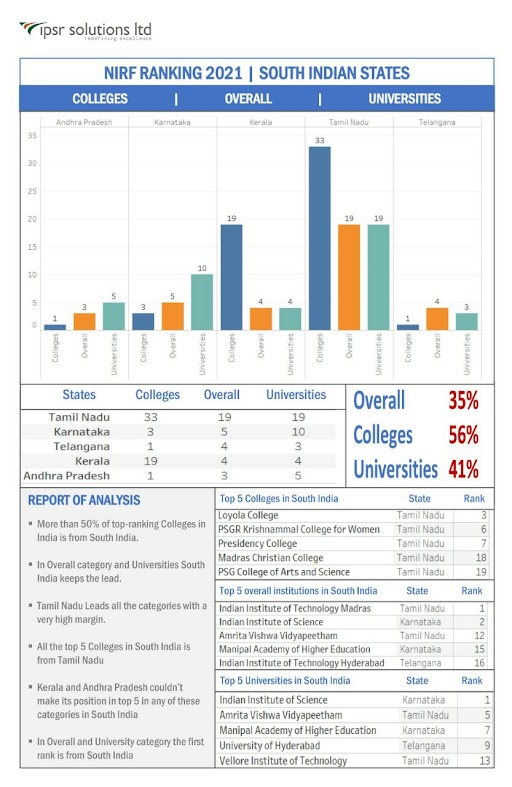
NIRF Ranking 2021 | South Indian States
 This report was created by IPSR Academix Data Analytics Team.
You may also like
Related posts
-
GraphQuest: Exploring the Logic of Links An Experiential Bootcamp on Graph Theory and Connectivity
In the spirit of how mathematics has always grown through patterns, connections, and careful reasoning - GraphQuest is designed as a 20-hour immersive bootcamp that brings the foundational ideas of Graph Theory to life. From the earliest problems of bridges and routes to today’s networks and algorithms, graphs have long been a quiet backbone of logical thinking. This bootcamp honours that tradition while presenting it in a way that feels hands-on, relevant, and engaging. Serving as a formative assessment, GraphQuest focuses on strengthening students’ understanding of basic graph-theoretic concepts through exploration, discussion, and guided practice. Instead of treating assessment as a final checkpoint, this bootcamp treats learning as a journey where mistakes are part of the process and connections slowly click into place. Learners actively build, analyse, and interpret graphs to demonstrate their growing command over ideas such as vertices, edges, paths, cycles, and connectivity. Across 20 structured hours, participants will move from intuitive, real-world linkages to formal mathematical representations, blending time-tested methods of problem-solving with interactive activities. The goal is simple but powerful: to ensure that every learner not only knows the definitions of Graph Theory, but truly gets how and why these ideas work. Think of it as old-school rigor, but with modern energy - focused, practical, and low-key exciting.
Task 1: Visual Graph Dictionary – “See the Shape of Logic”
Topics: Simple, Complete, Bipartite, Regular Graphs Activity: Each team creates a digital gallery of graph types using hand-drawn sketches or NetworkX visuals, labeling nodes, edges, and degrees. Learning Outcome: Identify and classify different types of graphs and relate visual structures to definitions. Deliverable: Visual collage or PPT poster of at least 6 graph types with short captions.
Task 2: Build Your Own Graph – “Nodes of Reality”
Topics: Directed, Undirected, Weighted Graphs Activity: Pick a real-world situation (Instagram followers, road network, WhatsApp chats etc.) and model it as a graph. Learning Outcome: Apply graph theory concepts to model real-world relationships. Deliverable: Graph diagram + explanation of why edges are directed/undirected.
Task 3: Degree Detective – “Count the Connections”
Topics: Incidence, Degree, Pendant, Isolated Vertices Activity: Construct small graphs and manually compute degrees of each vertex, identifying pendant and isolated vertices. Learning Outcome: Calculate vertex degrees and interpret graph connectivity. Deliverable: Tabular representation of degrees and classification of vertices.
Task 4: The Null Network – “When Nothing Connects”
Topics: Null Graphs, Incidence Matrix, Adjacency Matrix Activity: Visualize graphs and derive their incidence and adjacency matrices using Python / Excel. Learning Outcome: Translate visual graph structure into matrix form. Deliverable: Matrix representation + reflection on how it encodes edge information.
Task 5: Operation Lab – “Mix, Merge, and Modify”
Topics: Graph operations (Union, Intersection, Ring sum, Decomposition, Fusion) Activity: Perform operations on two small graphs and observe how edges and vertices change. Learning Outcome: Analyze results of graph operations and identify their use cases. Deliverable: Step-by-step comparison table and visual before/after diagrams.
Task 6: Pathfinder Challenge – “Find Your Way”
Topics: Walk, Path, Circuit Activity: Design an activity to trace all possible walks/paths/circuits between two given vertices on a hand-drawn or generated graph. Learning Outcome: Distinguish between walks, paths, and circuits; apply traversal logic. Deliverable: Path tracing worksheet + shortest-path identification.
Task 7: Isomorphism Hunt – “Different Looks, Same Logic”
Topics: Graph Isomorphism Activity: Draw all possible simple graphs on 2/3/4 vertices and prove or disprove isomorphism through degree sequences and adjacency matrices. Learning Outcome: Verify graph isomorphism through structural comparison. Deliverable: Written proof + supporting diagrams.
Task 8: Compiler Dependency Map – “Code Connections”
Topics: Subgraphs, Connected Components Activity: Represent modules or classes of a small software project as a graph, where edges represent dependencies or imports. Identify isolated modules and strongly connected subgraphs. Learning Outcome: Analyze software architecture using graph-theoretic methods. Deliverable: Dependency graph diagram + list of isolated or tightly coupled modules.
Task 9: Web Crawler Graph – “From Links to Networks”
Topics: Directed Graphs, Connectivity Activity: Simulate a web crawler: represent a small set of websites (pages) and their links as a directed graph. Analyze if the graph is strongly connected. Learning Outcome: Relate graph connectivity to web structure and information flow. Deliverable: Python notebook + visual representation of site linking.
Task 10: GraphVerse – “Connecting All the Connections”
Activity: Higher Order Thinking Challenge Description: To enhance analytical and evaluative thinking, each team must create 5 Higher Order Thinking (HOTS) questions covering the full set of graph theory topics learned. Instructions:
- Develop 5 higher-order thinking questions.
- Each question must align with Bloom’s higher cognitive levels (Apply, Analyze, Evaluate, Create).
- Include real-world applications, ethical perspectives, and creative problem-solving.
- Encourage inter‑topic integration (e.g., connectivity + isomorphism + real‑world networks).
Deliverables:
- A document or slide deck with 5 HOTS questions.
- Each question labeled with its Bloom’s cognitive level.
- (Optional) Include key points or a model answer for peer learning.
Learning Outcomes:
- Apply higher‑order reasoning to graph theory concepts.
- Demonstrate critical and creative thinking.
- Connect theory to real‑world computational and ethical scenarios.
- Strengthen academic discussion and leadership skills.
-
Formative and Summative Assessments in Outcome-Based Education Getting the Balance Right
Assessment has always been at the heart of education. Long before Outcome-Based Education (OBE) became a formal framework, teachers intuitively checked understanding during lessons and evaluated learning at the end of courses. OBE doesn’t discard this tradition—it refines it, aligns it, and makes it purposeful. At the core of OBE lie Formative and Summative assessments. Understanding their distinct roles - and using them intentionally - is what separates compliance-driven education from meaningful learning.
Assessment in OBE: More Than Just Marks
In OBE, assessment is not about how much content was covered, but how well outcomes were attained. Each assessment must answer a simple question: What evidence do we have that the learner achieved the intended Course Outcomes (COs)? That evidence comes from two complementary assessment types.
Formative Assessment: Learning in Motion
Formative assessment is assessment for learning. It happens during the teaching–learning process and provides continuous feedback to both learners and instructors.
Key Characteristics
- Conducted regularly
- Low-stakes or no-stakes
- Diagnostic and corrective
- Strongly aligned with COs and Bloom’s levels
- Focused on improvement, not judgement
Why It Matters in OBE
Formative assessments ensure that students are on track to achieve outcomes before it’s too late. They help faculty:
- Identify learning gaps early
- Modify teaching strategies
- Support diverse learners
- Build higher-order thinking gradually
Subject-wise Examples
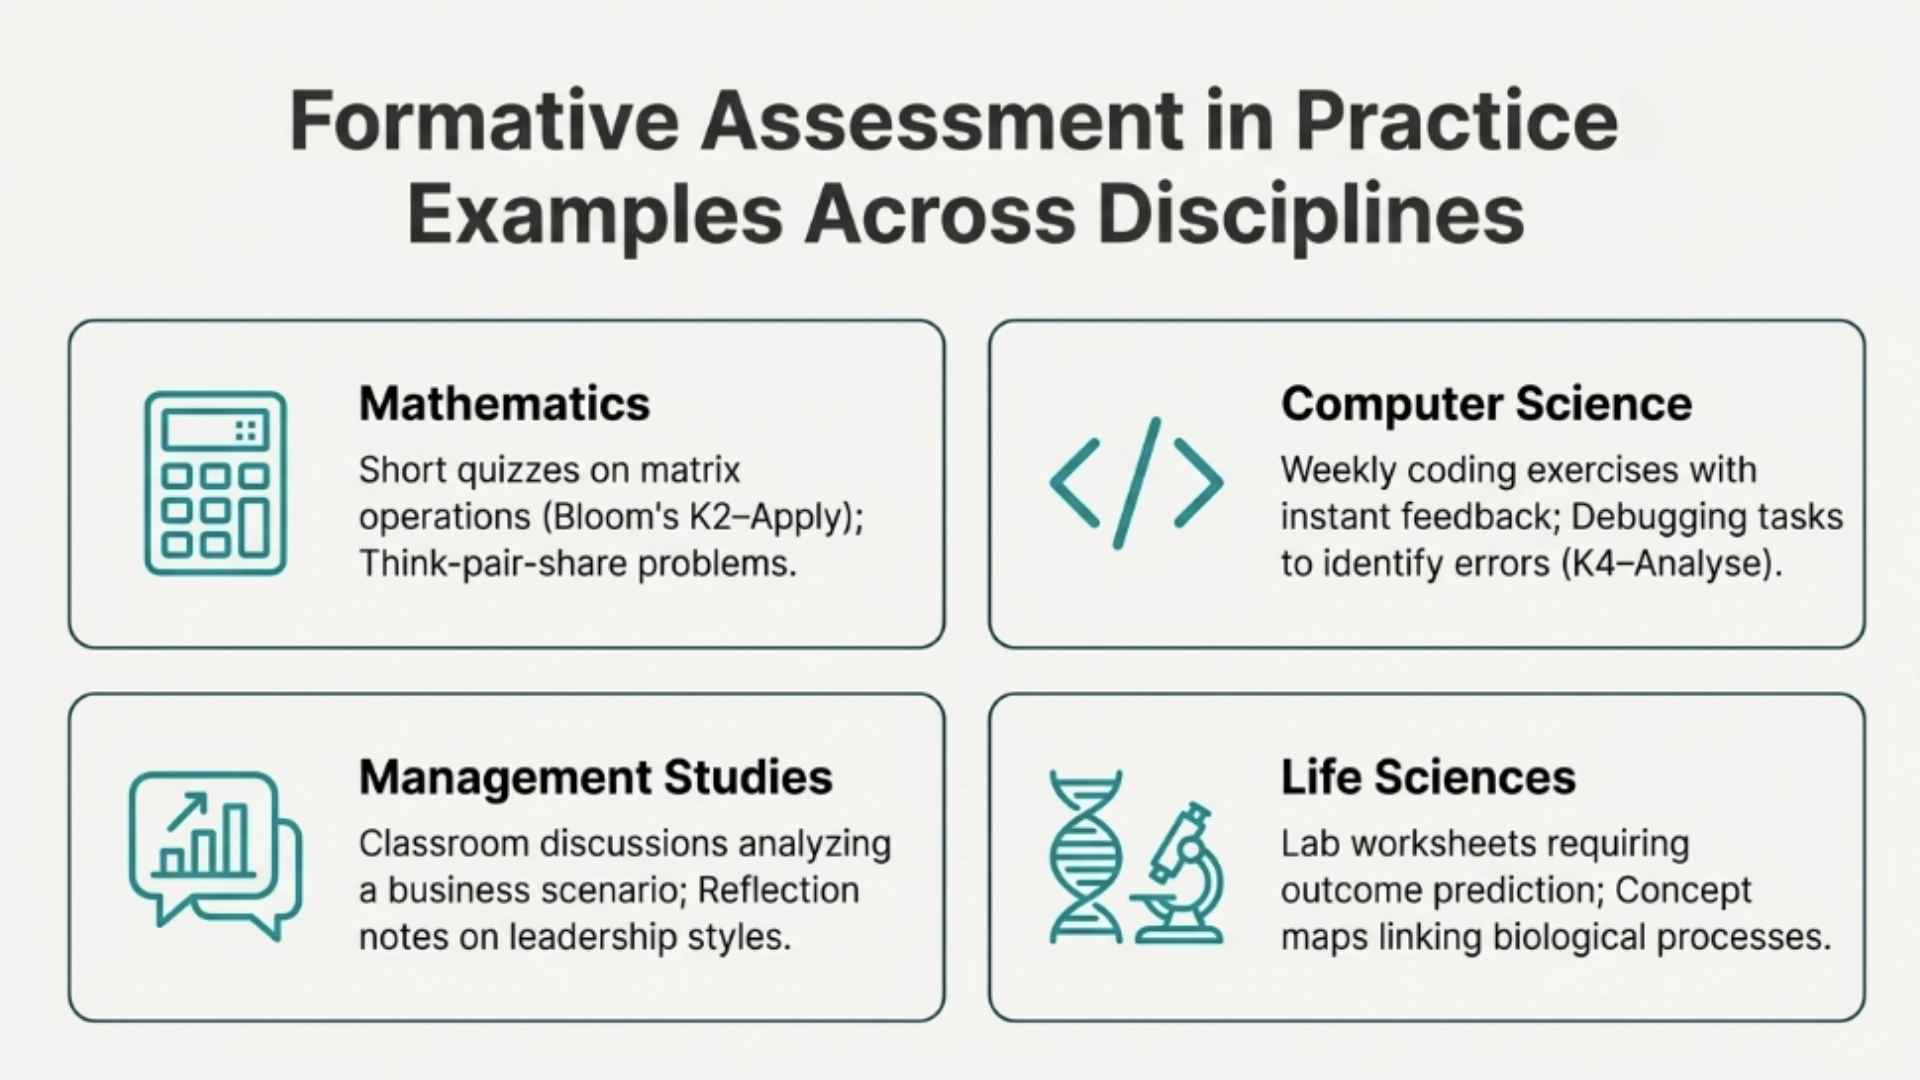 Mathematics
- Short quizzes on matrix operations to check procedural understanding (Bloom’s K2–Apply)
- Think-pair-share problems during lectures to test conceptual clarity
Computer Science
- Weekly coding exercises on loops or recursion with instant feedback
- Debugging tasks where students identify errors in given code (K4–Analyse)
Management Studies
- Classroom discussions analysing a short business scenario
- Reflection notes on leadership styles after a case discussion
Life Sciences
- Lab worksheets requiring students to predict outcomes before experiments
- Concept maps linking biological processes
Formative assessments create a safe space to fail, reflect, and fix. That’s real learning energy. From Principle to Practice Formative assessment becomes truly powerful when students experience learning as an active process rather than a series of checkpoints. Experiential designs, when aligned with course outcomes, create space for inquiry, mistakes, and conceptual clarity. For example, one way experiential formative assessment can be intentionally designed is illustrated through this linked article, GraphQuest: Exploring the Logic of Links. Structured as an outcome-aligned formative bootcamp, GraphQuest shows how experiential learning can be designed to meet OBE expectations with clear CO and Bloom’s level alignment.
Summative Assessment: Evidence of Achievement
Summative assessment is assessment of learning. It is conducted after sufficient learning has taken place and is used to certify achievement of outcomes.
Key Characteristics
- High-stakes
- Conducted at the end of a unit/course/semester
- Structured and standardized
- Used for grading, progression, and certification
- Strong CO–PO mapping relevance
Why It Matters in OBE
Summative assessments provide documented, auditable evidence of outcome attainment—critical for:
- Academic credibility
- Transparency
- Accreditation (NAAC, NBA, NIRF)
- Institutional accountability
Subject-wise Examples
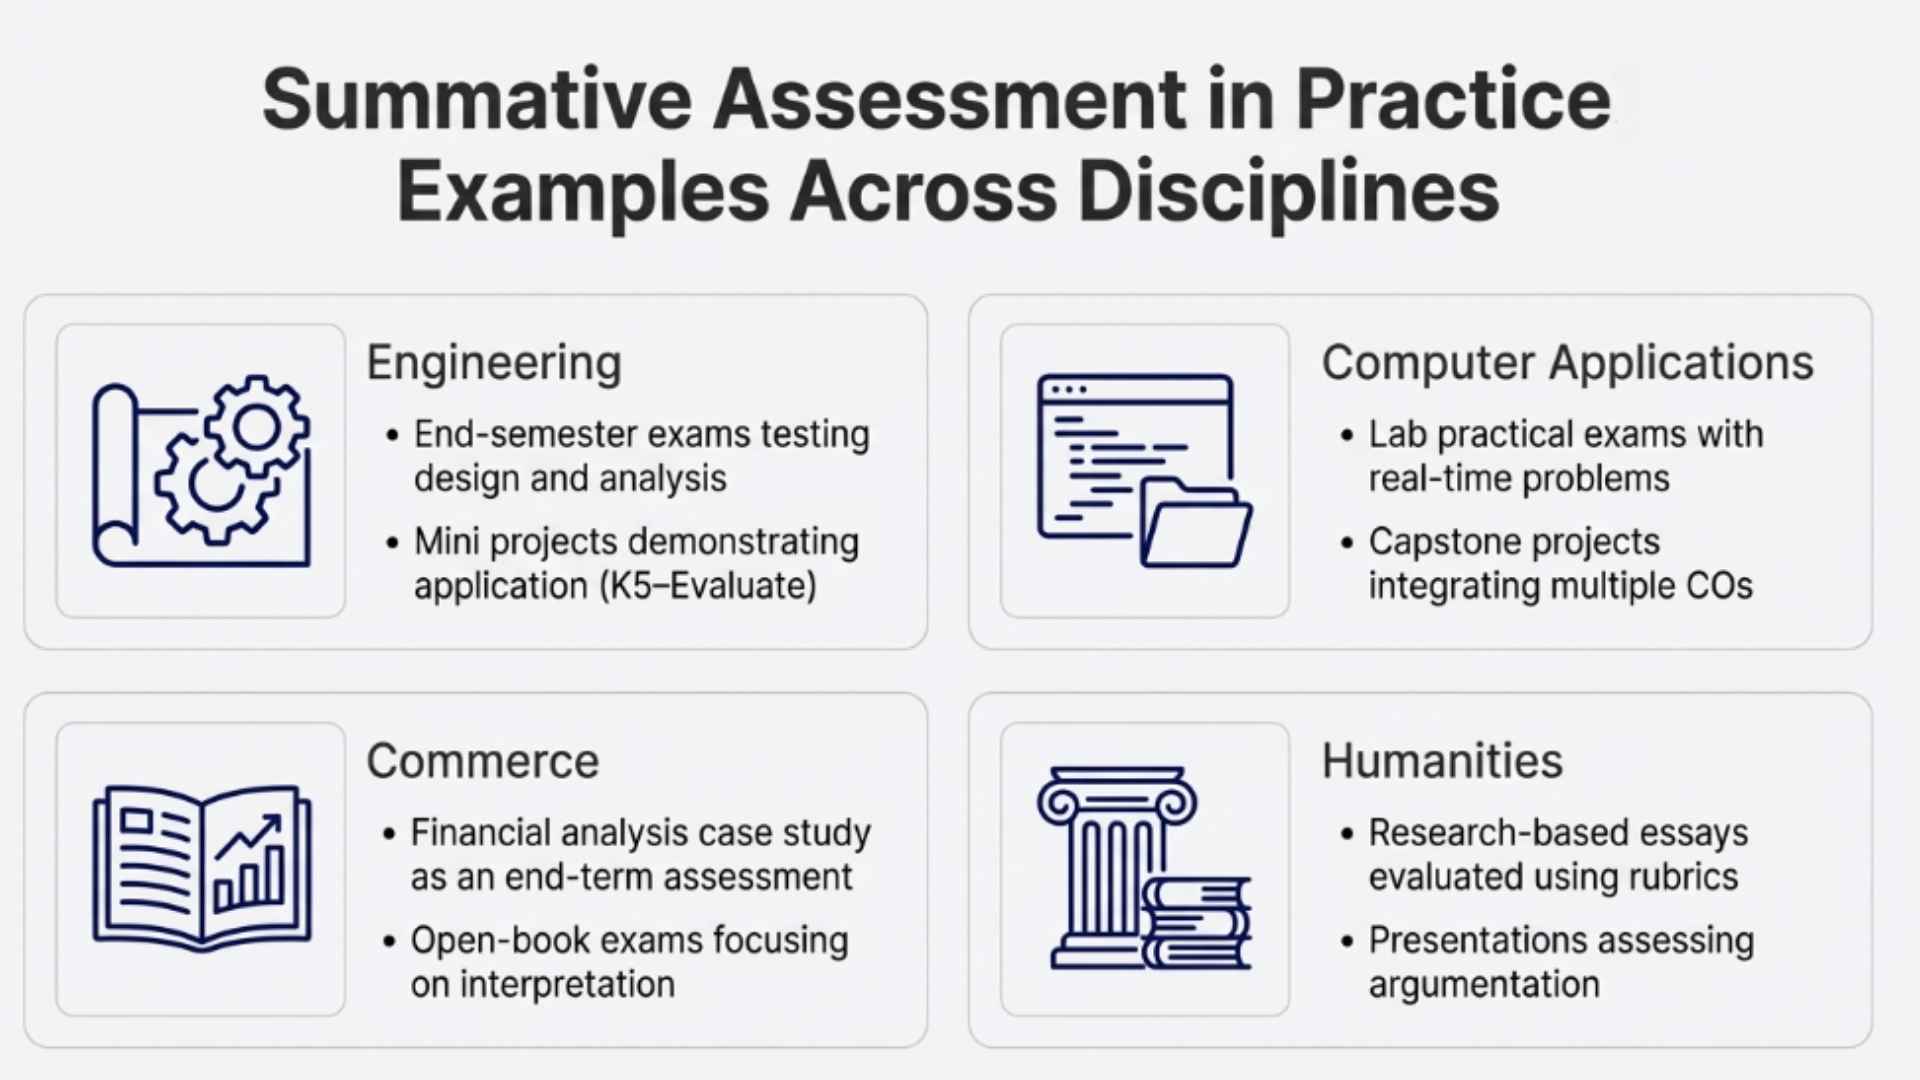 Engineering
- End-semester exams testing design, analysis, and problem-solving
- Mini projects demonstrating application of core concepts (K5–Evaluate)
Computer Applications
- Lab practical exams with real-time problem statements
- Capstone projects integrating multiple COs and POs
Commerce
- Financial analysis case study as an end-term assessment
- Open-book exams focusing on interpretation rather than memory
Humanities
- Research-based essays evaluated using rubrics
- Presentations assessing argumentation and critical thinking
Summative assessments answer the big question: Did the learner finally achieve what we promised?
Formative vs Summative: Not Either–Or, But Both
Aspect Formative Summative Purpose Improve learning Measure achievement Timing During learning End of learning Stakes Low High Feedback Immediate, descriptive Final, evaluative OBE Role Supports attainment Confirms attainment In strong OBE practice, formative feeds summative. When formative assessments are well-designed, summative success becomes natural—not stressful.
Common Mistakes Institutions Make
- Treating internal assessments only as mark-generation tools
- Overloading summative exams with memory-based questions
- Weak alignment between COs, Bloom’s levels, and assessment tasks
- Ignoring formative data during attainment analysis
OBE expects intentional design, not mechanical compliance.
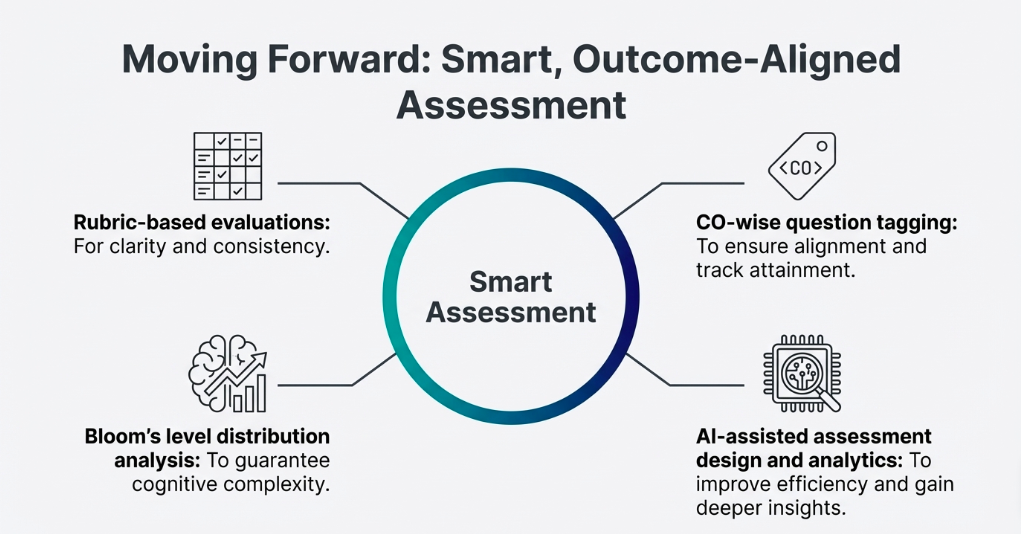
Moving Forward: Smart, Outcome-Aligned Assessment
Modern institutions are now leveraging:
- Rubric-based evaluations
- CO-wise question tagging
- Bloom’s level distribution
- AI-assisted assessment design and analytics
 Yet, the philosophy remains traditional and timeless: Teach with care. Assess with clarity. Improve with evidence. When formative and summative assessments work together, education shifts from marks-driven to meaning-driven. And that’s where real outcomes happen. Author’s Note This article is grounded in practical OBE implementation experience across higher education institutions, aligned with accreditation frameworks and contemporary assessment research, while respecting long-standing pedagogical principles. [/fusion_text][/fusion_builder_column][/fusion_builder_row][/fusion_builder_container]
 -
Gemini 3 Deep Think: What Faculty Should Know
Google’s most advanced reasoning mode yet — ideal for teaching, research, and academic workflows.
Stronger Reasoning for Complex Tasks
- Gemini 3 Deep Think delivers industry-leading reasoning that tackles deep, multi-step problems in areas like logic, math, and scientific analysis.
- It uses parallel and iterative reasoning rather than surface-level pattern matching, making it more reliable for high-cognitive tasks.
- For academics: This means less time refining prompts and more time getting coherent, structured insights — especially useful in research design or advanced problem breakdowns.
Helps With Research Rigour
- The enhanced reasoning supports complex hypothesis evaluation and breakdown, aiding literature synthesis, experiment planning, and detailed analytic work.
- For grant writing and publication drafts, the model’s reasoning aids clarity and logical structure in narratives.
Better Outputs With Less Prompting
- Gemini 3 is designed to understand context and intent more deeply, yielding richer and more relevant responses with fewer instructions.
- Faculty can get higher-quality responses for curriculum queries, detailed explanations, and teaching examples without repeated back-and-forth.
Supports Multi-Modal Content
- Beyond text alone, Gemini 3 handles images, audio, video, and code within the same reasoning context — a huge gain for researchers and educators dealing with multimedia materials.
- Useful for visual data analysis, lecture prep with images/videos, and interactive instructional materials.
Accelerated Curriculum Development
- The model’s advanced reasoning and multimodal abilities can help craft lesson sequences, assessment items, case scenarios, and even simulated classroom discussions more efficiently.
Academic Collaboration & Mentoring
- Faculty can use Gemini to produce clearer feedback on student work, generate alternative explanations, and co-develop learning resources.
- It can serve as a smart co-pilot for brainstorming research questions or curricular improvements.
Benchmark-Level Performance
- Deep Think outperforms prior models on benchmarks that simulate real reasoning stress tests, indicating that its answers are more thoughtful and structured, not just generative text.
In a nutshell: For faculty members, the new Gemini release isn’t just about faster answers — it’s about deeper, more structured thinking, richer multimodal understanding, and higher-fidelity educational and research support. These enhancements can streamline teaching prep, elevate research quality, and make classroom engagement more insightful.


